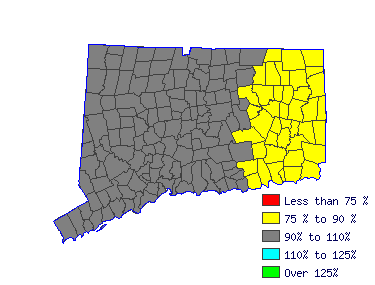
| Southwest Workforce Investment Area (1Q 2015) |
| All Industry |
| Estimated employment | 430 |
| Mean wage | $74,515 |
| Entry wage | $51,827 |
| 10th percentile wage | $48,615 |
| 50th percentile wage | $75,162 |
| 90th percentile wage | $102,131 |
 | | Top Employing Industries |
| Industry | Employment | % |
| Education & Health Services | 420 | 99.7% |
 |
| Best Paying Industries |
| Industry | Employment | Median
Wage |
| Education & Health Services | 420 | 74,634 |
 | |
 |
| Kindergarten Teachers, Except Special Education (25-2012) |
| Teach elemental natural and social science, personal hygiene, music, art, and literature to children from 4 to 6 years old. Promote physical, mental, and social development. May be required to hold State certification. Exclude "Special Education Teachers" (25-2041 through 25-2043). |
| Mean Wage History |
| Year | This Occupation | Compared to
Occupational Group | Difference |
| Current | $74514.54 | | $59890.07 |
| $14624.47 | | 2014 | $74152.23 | +.5% | $59598.87 |
+.5% | $14553.36 | | 2013 | $72763.39 | +1.9% | $58482.60 |
+1.9% | $14280.78 | | 2012 | $71374.54 | +1.9% | $57366.34 |
+1.9% | $14008.20 | | 2011 | $69985.70 | +2.0% | $56250.07 |
+2.0% | $13735.62 | | 2010 | $68898.78 | +1.6% | $55376.47 |
+1.6% | $13522.30 | | 2009 | $67691.09 | +1.8% | $54405.81 |
+1.8% | $13285.28 | | 2008 | $66966.47 | +1.1% | $53823.41 |
+1.1% | $13143.06 | | 2007 | $64973.78 | +3.1% | $52221.81 |
+3.1% | $12751.97 | | 2006 | $62799.94 | +3.5% | $50474.61 |
+3.5% | $12325.32 |
| Year | This Occupation | Compared to
All Occupations | Difference |
| Current | $74514.54 | | $63821.30 |
| $10693.24 | | 2014 | $74152.23 | +.5% | $63300.73 |
+.8% | $10851.50 | | 2013 | $72763.39 | +1.9% | $61947.27 |
+2.2% | $10816.12 | | 2012 | $71374.54 | +1.9% | $60697.91 |
+2.1% | $10676.63 | | 2011 | $69985.70 | +2.0% | $59656.78 |
+1.7% | $10328.92 | | 2010 | $68898.78 | +1.6% | $58719.76 |
+1.6% | $10179.02 | | 2009 | $67691.09 | +1.8% | $57730.69 |
+1.7% | $9960.40 | | 2008 | $66966.47 | +1.1% | $56949.84 |
+1.4% | $10016.63 | | 2007 | $64973.78 | +3.1% | $55492.26 |
+2.6% | $9481.52 | | 2006 | $62799.94 | +3.5% | $53722.33 |
+3.3% | $9077.60 |
|
Reference Date: 1st Quarter 2015 |
State of Connecticut Department of Labor Office of Research
200 Folly Brook Boulevard Wethersfield, CT 06109
Phone: 860-263-6285 |

| | | | |
| Top Areas For This Occupation |
|
|
|
 |
|


